
- Messages
- 3,042
- Location
- Stoke on Trent, Staffordshire
Apart from a mis-change from third to fourth that is!
Today for me, it is Microsoft Excel...the graphic should explain it all.
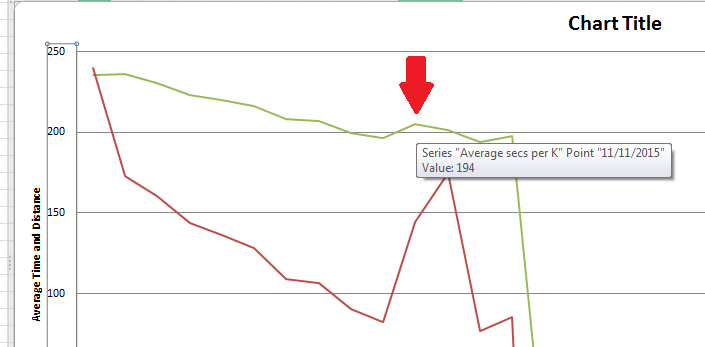
Tried messing with the axis data, chart size, the lot, no joy. It cannot plot the data accurately!
Today for me, it is Microsoft Excel...the graphic should explain it all.
Tried messing with the axis data, chart size, the lot, no joy. It cannot plot the data accurately!
